Welcome back to Home Economics, a data-driven newsletter about the American housing market. Today’s article is about the relationship between household incomes and home prices. Subscribe/upgrade here:
This article was written with research assistance from Sarthak Vij. Sarthak is a master's candidate at Johns Hopkins, pursuing an M.S. in Financial Economics. He is a former strategy consultant and aims to build a career in economic consulting, more specifically in antitrust and competition economics.
YIMBYs (Yes In My Backyard-ers) are buzzing after last week’s Democratic National Convention, where Kamala Harris pledged a raft of housing measures. She promised zoning reform, tax incentives to builders, and less red tape and bureaucracy, amongst other measures. In theory, most of these policies would work by boosting housing supply, thereby lowering prices and improving affordability.
I’m in favor of the spirit of the legislation, if not all of the details. In fact, the benefit of these kinds of policies is playing out on my doorstep.
The Gowanus example
Home Economics is produced in Gowanus, Brooklyn, a neighborhood historically characterized by abandoned industrial sites and a stinking, fetid canal.
But they’re dredging the canal, and these days the area reverberates with the sounds of cement trucks, the pounding of pile drivers, and the echo of cranes lowering steel girders. Apartment buildings are shooting up all around me.
All of this cleaning and building was catalyzed by rezoning and tax abatements implemented in 2021. The result is that this former no man’s land is turning into what I believe will be New York City’s most dynamic neighborhood within a few years.
Home prices and buying power
But, even if rezoning and tax incentives reshape the city in this way—by injecting dense housing supply into the heart of the city, where it belongs—I struggle to imagine it will do much to help affordability. That’s because supply is a much more marginal determinant of house prices than other factors—local area incomes in particular.
I’ve had the delight of working with a talented graduate student from Johns Hopkins over the past few weeks, Sarthak Vij, who ran the numbers to help me make this point empirically. He looked at the relationship between median household incomes and home prices across all US counties.
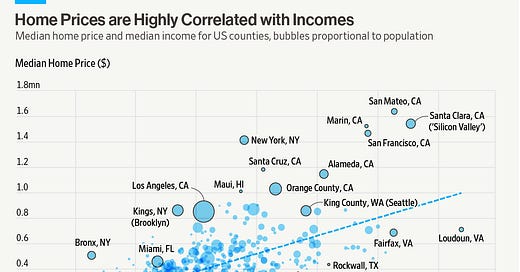
Local incomes do a very good job of explaining the variation in home prices (the r-square is 0.51). Correlation is not causation, but it’s a good starting point for understanding the mechanism at work here.
Moreover, this relationship has strengthened: over the past decade, home prices and incomes have become even more tightly coupled.
Income is not everything
Income doesn’t explain everything about home prices, though.
San Francisco (and nearby Alameda, Marin, and San Mateo counties), Seattle, New York, Los Angeles, and Silicon Valley (including nearby-ish Santa Cruz) all lie above the trendline: prices there are more expensive than what you’d think, based on local incomes.
To be clear: in all of these places, incomes are very high. It’s just that home prices are absolutely exorbitant. I would imagine extreme wealth, a deeply unequal distribution of income, and understated incomes due to tax sheltering explain some of this.
Meanwhile, in places like Maui, Honolulu, Miami, and Mendocino, it’s perhaps out-of-state wealth, lured by natural beauty, that lie behind high prices.
Most of the counties that lie below the trendline share similar features: they are proximal to large economies, but are suburban in nature, and at some distance to dense, urban centers. Loudon and Fairfax, VA—both are close to Washington, D.C.—fall into this camp. Similarly, Sussex, NJ is a commuter town to New York City, but rural in nature. In these suburbs, land is plentiful and construction costs are relatively low. This feeds into relatively low home prices, despite high local incomes.
Still, these are deviations from the trend: home prices go hand in hand with incomes to a degree we simply don’t see between prices and other variables1.
Rising incomes explain rising prices
Changes in incomes also do a good job of explaining changes in home prices over time, across counties.
Homes in Silicon Valley didn’t skyrocket in a vacuum—local incomes powered them upwards. Similarly, the disappointment I recently felt when I sold my New York City apartment for not much more than I bought it reflects weak price appreciation here amidst tepid income growth.
The chart below illustrates this: it shows the evolution of home prices and incomes in counties with populations over 1 million from 2014 to 2022. Each sperm line and bubble (the lines represent historical prices and incomes, the bubbles represents the latest values) traces an up-and-to-the-right path: rising home prices have occurred alongside rising local incomes.
To be fair, the ratio of home prices to incomes is relatively high today. But, for a number of reasons—including a surge of transactions in 2020-21 at low interest rates—homeowners are on average spending only 29% of their pre-tax income on housing. This is similar to just before the pandemic, and to the long run level2.
So what?
Americans feel housing is too expensive, and changing regulations and tweaking tax incentives is, oddly enough, popular across the political spectrum. Kamala Harris should continue down this path because it’s simply good campaign strategy.
But loosening regulation to help unlock supply will only help on the margins. It constitutes rearranging the deck chairs while the Titanic is sinking.
If a shocking number of people fall below some reasonable threshold of what we deem fair to spend on housing—whether that’s 30% or 50%, or some other figure—then that is a problem primarily to do with the unequal distribution of incomes, not of regulation and housing supply.
I posted a similar comment on NZ housing recently. Rents are consistently related to incomes and as a blogger for property investment I had not looked hard at house prices. My first look found a similar relationship between HH Incomes and prices. https://johnbutt.substack.com/p/house-price-forecasts
Housing is a normal good and as incomes rise there is more demand for normal goods. If you don't increase the supply to meet that new demand then the price goes up. You are missing half the equation. Cities below your trend line likely have more supply or the ability to increase supply.